
Building a Scalable Reporting Pipeline in Salesforce Marketing Cloud

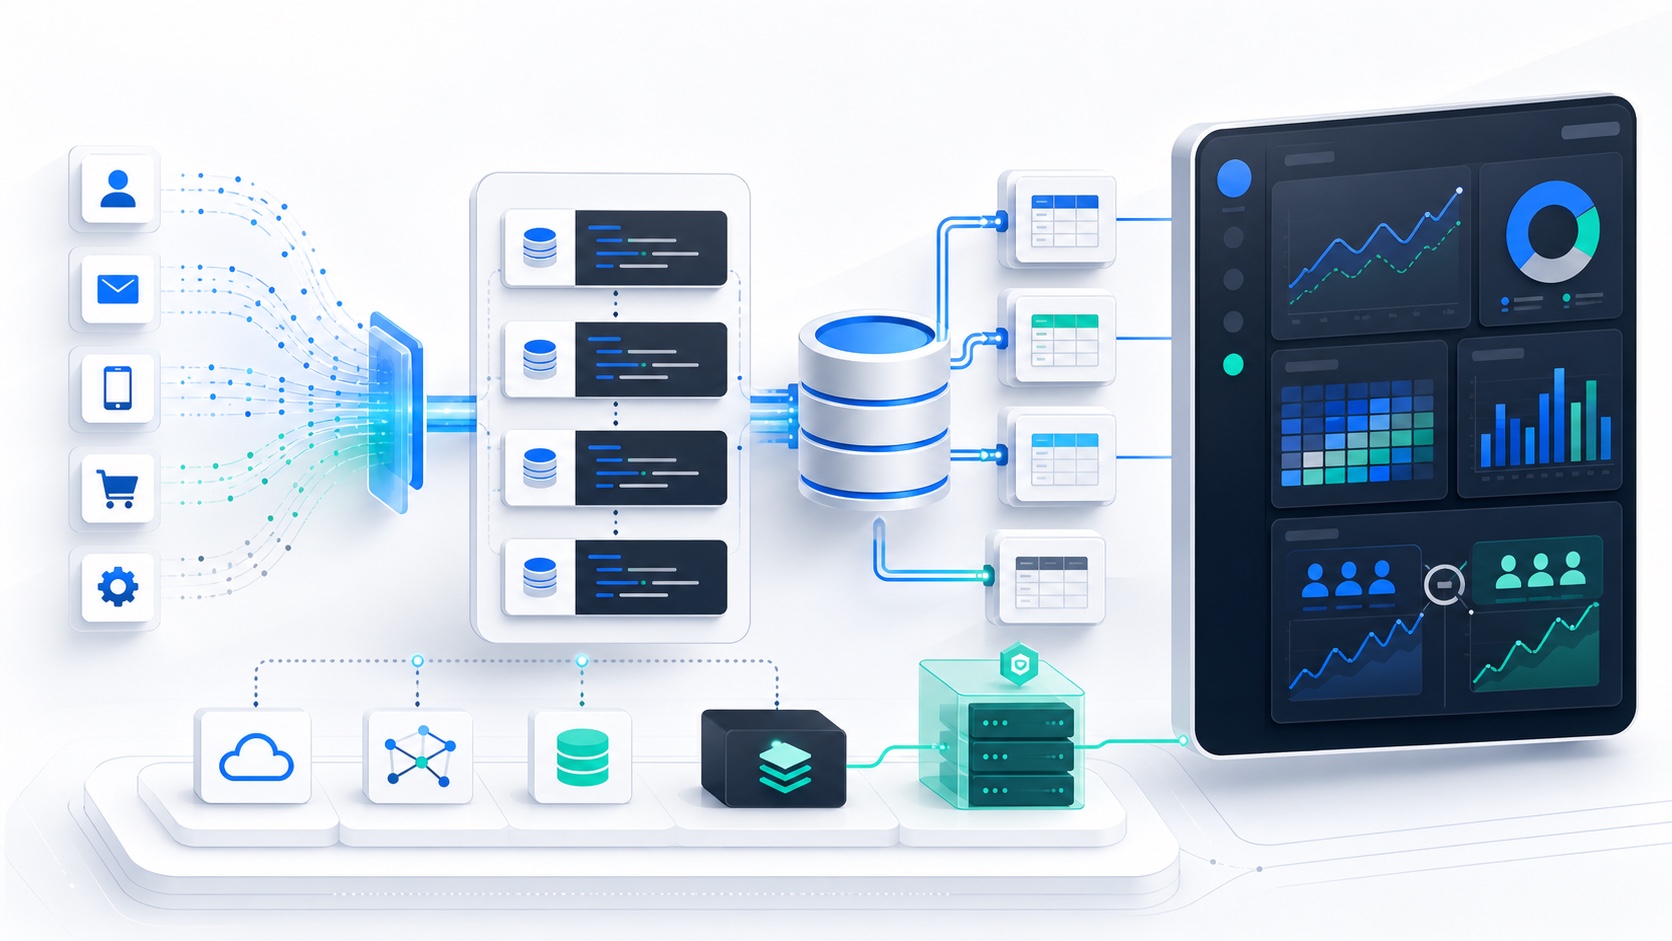
Table of contents
Introduction
Reporting infrastructure is part of lifecycle engineering. If the reporting layer cannot explain what happened, the lifecycle team cannot decide what to build next, which journeys to fix, which campaigns to suppress, or which tests were actually meaningful.
This case study explains how I designed a scalable reporting pipeline inside Salesforce Marketing Cloud, then extended it into a reporting application using the SFMC REST API, Next.js, Supabase, cached reporting, dashboard APIs, and statistical significance calculations for A/B testing.
The goal was not to write one impressive SQL query. The goal was to design a reporting system that could be maintained, debugged, extended, and trusted.
Business Problem
Lifecycle reporting often starts as campaign screenshots and spreadsheet exports. That works until the program grows. Once the team is running journeys, triggered campaigns, broadcasts, A/B tests, segment-specific promotions, and multi-step automations, reporting needs to answer harder questions.
The business needed to know:
- Which campaigns generated engagement?
- Which journeys created movement?
- Which audiences responded?
- Which emails drove clicks after removing unsubscribe noise?
- Which activities belonged to which journeys?
- Which tests were statistically meaningful?
- Which trends held over time?
- Where did performance change after lifecycle logic changed?
The reporting also had to be repeatable. A dashboard that depends on someone exporting _Sent, _Open, and _Click every Monday is not infrastructure. It is a ritual.
Why Native Platform Features Weren’t Enough
Salesforce Marketing Cloud Data Views are useful source tables, but they are not a complete long-term reporting architecture by themselves. Salesforce documents SQL Query Activities as a way to retrieve and unify data across data extensions and system data views in Automation Studio. Data Views and SQL are powerful, but raw engagement views are still operational sources, not analytics models.
There were several limitations:
- Raw Data Views are not shaped for dashboard queries.
- Engagement data needs enrichment with send, journey, and activity metadata.
- Long-term reporting can be affected by retention and access policies.
- Querying raw views repeatedly makes dashboards slower and harder to debug.
- A single monolithic SQL query becomes fragile as reporting requirements grow.
- A/B test reporting requires variant-level aggregation and statistical calculations.
Salesforce has also published changes to Marketing Cloud Engagement data retention policy over time, which reinforces the architectural point: durable reporting should not depend on querying raw operational views forever. See Salesforce’s engagement data retention policy update for current platform context.
The right architecture was to treat Data Views as sources, then build permanent reporting datasets.
Solution Architecture
The reporting architecture had two layers: an SFMC SQL pipeline and an external reporting app.
SFMC System Data Views
  _Sent
  _Open
  _Click
  _Unsubscribe
  _Journey
  _JourneyActivity
        |
        v
Isolated SQL Transformations
  1. send facts
  2. open facts
  3. click facts
  4. unsubscribe facts
  5. journey metadata map
        |
        v
Master Reporting Data Extension
  one reporting grain per subscriber / job / activity
        |
        v
Summary Reporting Data Extensions
  campaign daily
  journey daily
  activity daily
  variant daily
        |
        v
Reporting App
  SFMC REST API
  Next.js API routes
  Supabase cache
  dashboard UI
  statistical significance module
The key design decision was separating raw extraction, enrichment, and dashboard summaries. Dashboards should not query raw engagement tables directly. They should query summary datasets that have already done the expensive joins and normalization work.
That design improved maintainability, query performance, debugging, historical stability, dashboard consistency, and A/B test analysis. It also made the reporting system easier to explain to non-engineering stakeholders because each layer had one responsibility.
Technical Implementation
The SQL pipeline was split into isolated transformations. This made the system easier to debug because each query had one job.
The first layer extracted send facts:
SELECT
  s.JobID,
  s.SubscriberKey,
  s.EventDate AS SentAt,
  s.TriggererSendDefinitionObjectID,
  s.BatchID
FROM _Sent s
WHERE s.EventDate >= DATEADD(day, -7, GETDATE())
The next layer enriched opens. Unique opens and total opens are different metrics, so the reporting model needed to preserve event-level data before summarizing.
SELECT
  o.JobID,
  o.SubscriberKey,
  MIN(o.EventDate) AS FirstOpenAt,
  COUNT(*) AS TotalOpens
FROM _Open o
WHERE o.EventDate >= DATEADD(day, -7, GETDATE())
GROUP BY
  o.JobID,
  o.SubscriberKey
Clicks were handled similarly, but with link-level context where needed.
SELECT
  c.JobID,
  c.SubscriberKey,
  MIN(c.EventDate) AS FirstClickAt,
  COUNT(*) AS TotalClicks
FROM _Click c
WHERE c.EventDate >= DATEADD(day, -7, GETDATE())
GROUP BY
  c.JobID,
  c.SubscriberKey
Then journey metadata was joined in through activity identifiers.
SELECT
  ja.JourneyActivityObjectID,
  ja.ActivityName,
  ja.ActivityType,
  j.JourneyName,
  j.VersionNumber,
  j.JourneyStatus
FROM _JourneyActivity ja
LEFT JOIN _Journey j
  ON ja.VersionID = j.VersionID
The master reporting table combined these transformations into a stable grain:
Master_Email_Reporting
----------------------
SubscriberKey
JobID
JourneyName
JourneyVersion
ActivityName
ActivityType
SentAt
FirstOpenAt
FirstClickAt
UnsubscribedAt
CampaignName
Variant
AudienceSegment
From there, summary tables powered dashboards:
SELECT
  CAST(SentAt AS DATE) AS ReportDate,
  JourneyName,
  ActivityName,
  Variant,
  COUNT(*) AS Sends,
  SUM(CASE WHEN FirstOpenAt IS NOT NULL THEN 1 ELSE 0 END) AS UniqueOpens,
  SUM(CASE WHEN FirstClickAt IS NOT NULL THEN 1 ELSE 0 END) AS UniqueClicks,
  SUM(CASE WHEN UnsubscribedAt IS NOT NULL THEN 1 ELSE 0 END) AS Unsubscribes
FROM Master_Email_Reporting
GROUP BY
  CAST(SentAt AS DATE),
  JourneyName,
  ActivityName,
  Variant
The reporting app sat on top of those summary datasets. Next.js provided the application layer. Supabase stored cached reporting responses and normalized dashboard snapshots. The SFMC REST API was used to retrieve reporting exports or Data Extension rows depending on the endpoint design.
Dashboard request
        |
        v
Next.js API route
        |
        | check cache
        v
Supabase reporting cache
        |
        | cache miss
        v
SFMC REST API
        |
        v
Normalize response
        |
        v
Store cache + return dashboard payload
The API returned dashboard-ready JSON rather than raw SFMC rows:
{
  "dateRange": "last_30_days",
  "journey": "Loan Nurture",
  "summary": {
    "sends": "summary_sends",
    "uniqueClicks": "summary_unique_clicks",
    "unsubscribes": "summary_unsubscribes"
  },
  "variants": [
    {
      "name": "A",
      "sends": "variant_a_sends",
      "conversions": "variant_a_conversions"
    },
    {
      "name": "B",
      "sends": "variant_b_sends",
      "conversions": "variant_b_conversions"
    }
  ]
}
Those values are placeholders, not business outcomes. The point is the shape of the API response: the dashboard should receive normalized data that is already grouped for the view it is rendering.
A/B testing required a statistical module rather than simple winner labels. The simplified pseudocode was:
function zTest(controlConversions, controlSends, testConversions, testSends) {
  const p1 = controlConversions / controlSends;
  const p2 = testConversions / testSends;
  const pooled = (controlConversions + testConversions) / (controlSends + testSends);
  const standardError = Math.sqrt(
    pooled * (1 - pooled) * (1 / controlSends + 1 / testSends)
  );
  const z = (p2 - p1) / standardError;

  return {
    controlRate: p1,
    testRate: p2,
    lift: (p2 - p1) / p1,
    zScore: z
  };
}
The dashboard could then separate “variant B is ahead” from “variant B has enough evidence to call.”
Engineering Decisions & Tradeoffs
The first major decision was splitting SQL into multiple transformations. A monolithic query can feel efficient because all logic lives in one place. It becomes difficult to debug when a metric changes unexpectedly. Is the problem in the open join? The click dedupe? The journey metadata? The unsubscribe logic? Is it a source issue?
Isolated transformations make failures local.
The second decision was creating a master reporting dataset before summaries. Summary tables are fast, but they are lossy. A master table preserves enough detail to rebuild summaries without going back to raw Data Views every time.
The third decision was having dashboards query summary datasets, not raw engagement views. Dashboards need speed and stability. Raw views need transformation. Those are different responsibilities.
The fourth decision was caching external API responses in Supabase. SFMC APIs and reporting exports should not be called repeatedly for the same dashboard filter if the underlying reporting data has not changed. Caching reduced latency and made the dashboard more predictable.
The tradeoffs were real:
- More tables to govern inside SFMC.
- More automation dependencies to monitor.
- Slight reporting delay because summaries update on schedule.
- Better reliability because each layer can be tested independently.
- Better performance because dashboards read already-shaped data.
- Better debugging because a broken metric can be traced to a specific transformation.
This is the same philosophy behind Lifecycle Marketing KPIs: The Only 7 Metrics That Matter: measure the business movement, but build the data model carefully enough that the metric can be trusted.
Lessons Learned
The first lesson is that reporting is a product. Internal users rely on it to make decisions. If the dashboard is slow, inconsistent, or impossible to debug, it will lose trust.
The second lesson is that raw engagement tables are not reporting models. Sends, opens, clicks, unsubscribes, journey metadata, and activity metadata need to be joined into a durable grain before they become useful.
The third lesson is that summary datasets are not premature optimization. They are a boundary between transformation work and dashboard work. The dashboard should not be responsible for redoing warehouse-style logic on every request.
The fourth lesson is that A/B testing needs statistical context. A higher click or conversion rate does not automatically mean a winner. Sample size, variance, and confidence matter.
The fifth lesson is that lifecycle reporting should include failure visibility. Row counts, last-run timestamps, API errors, cache status, and empty-result alerts are not nice-to-haves. They are part of the system.
Closing Thoughts
The reporting pipeline worked because it treated Salesforce Marketing Cloud as a source system, not the final analytics layer.
Data Views supplied raw engagement events. SQL transformations enriched and stabilized the data. Master reporting datasets preserved detail. Summary datasets made dashboards fast. Next.js and Supabase turned the reporting layer into an application that could cache, filter, and calculate test results.
That is lifecycle engineering: not just sending the right message, but building the infrastructure that proves whether the message moved the customer.
Get one retention idea, every other week
The Lifecycle Letter. One actionable retention idea in your inbox, no fluff, unsubscribe anytime.